Blur NFT Marketplace: A Comprehensive Analysis and Trading Strategies
Emerging as a haven for NFT traders and collectors, Blur NFT Marketplace stands out with its unique features and user-centric approach. Unlike conventional marketplaces, Blur seamlessly integrates aggregation services, empowering users with advanced features such as real-time price feeds, comprehensive portfolio management tools, and multi-marketplace NFT comparisons. Additionally, Blur boasts a superior NFT sweeping mechanism, ensuring swift and efficient transaction execution. Perhaps the most compelling aspect of Blur lies in its zero trading fees, a significant advantage that attracts traders seeking to maximize their profits.
Blur Token: Empowering Governance and Ecosystem Growth
Blur introduces its native governance token, aptly named BLUR, an Ethereum-based ERC-20 token that grants holders the power to participate in network governance decisions. These decisions encompass a wide range of issues, including network upgrades, feature implementations, and future development initiatives. Furthermore, Blur incentivizes NFT creators by providing them with additional BLUR tokens alongside their standard royalty fees, fostering a collaborative and mutually beneficial ecosystem.
Long-Term Prospects: Poised for Substantial Growth
Blur's decentralized nature, coupled with its unique tokenomics, positions it as a promising platform with immense long-term potential. Its ability to attract both creators and traders through its innovative features and rewarding mechanisms sets the stage for substantial growth and value appreciation.
Technical Analysis: Unveiling Price Movements and Trading Opportunities
Monthly Chart: Uptrend in Sight
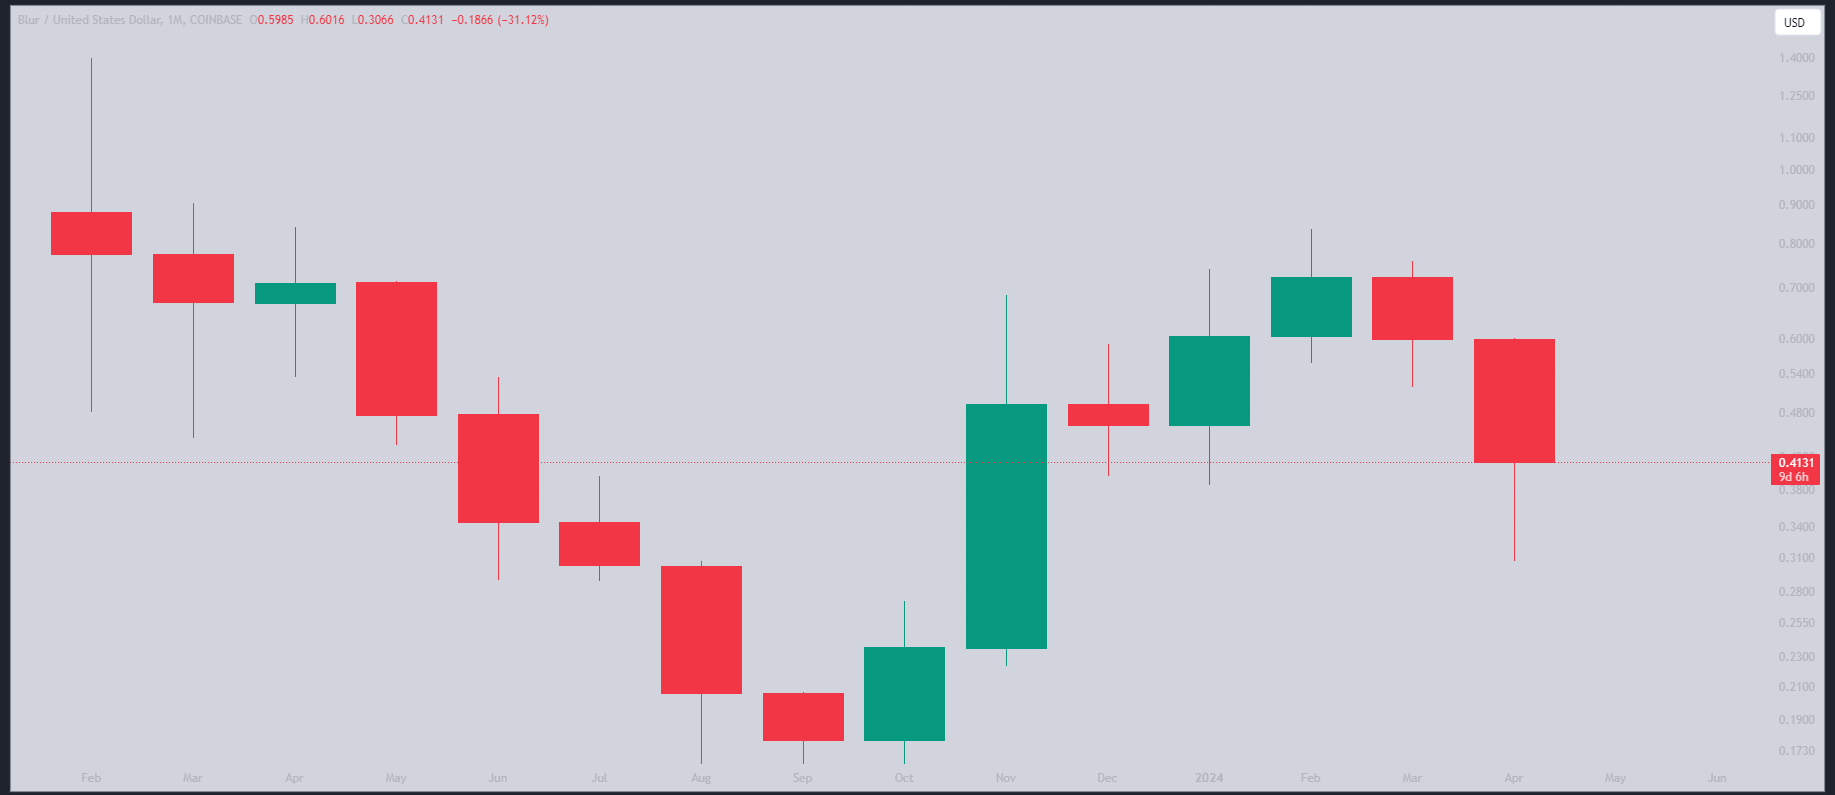
Currently, Blur is in a consolidation phase, poised for an upward breakout. Once the underlying liquidity is absorbed, a significant upward surge is anticipated.
Weekly Chart: Bullish Momentum and Potential Breakout
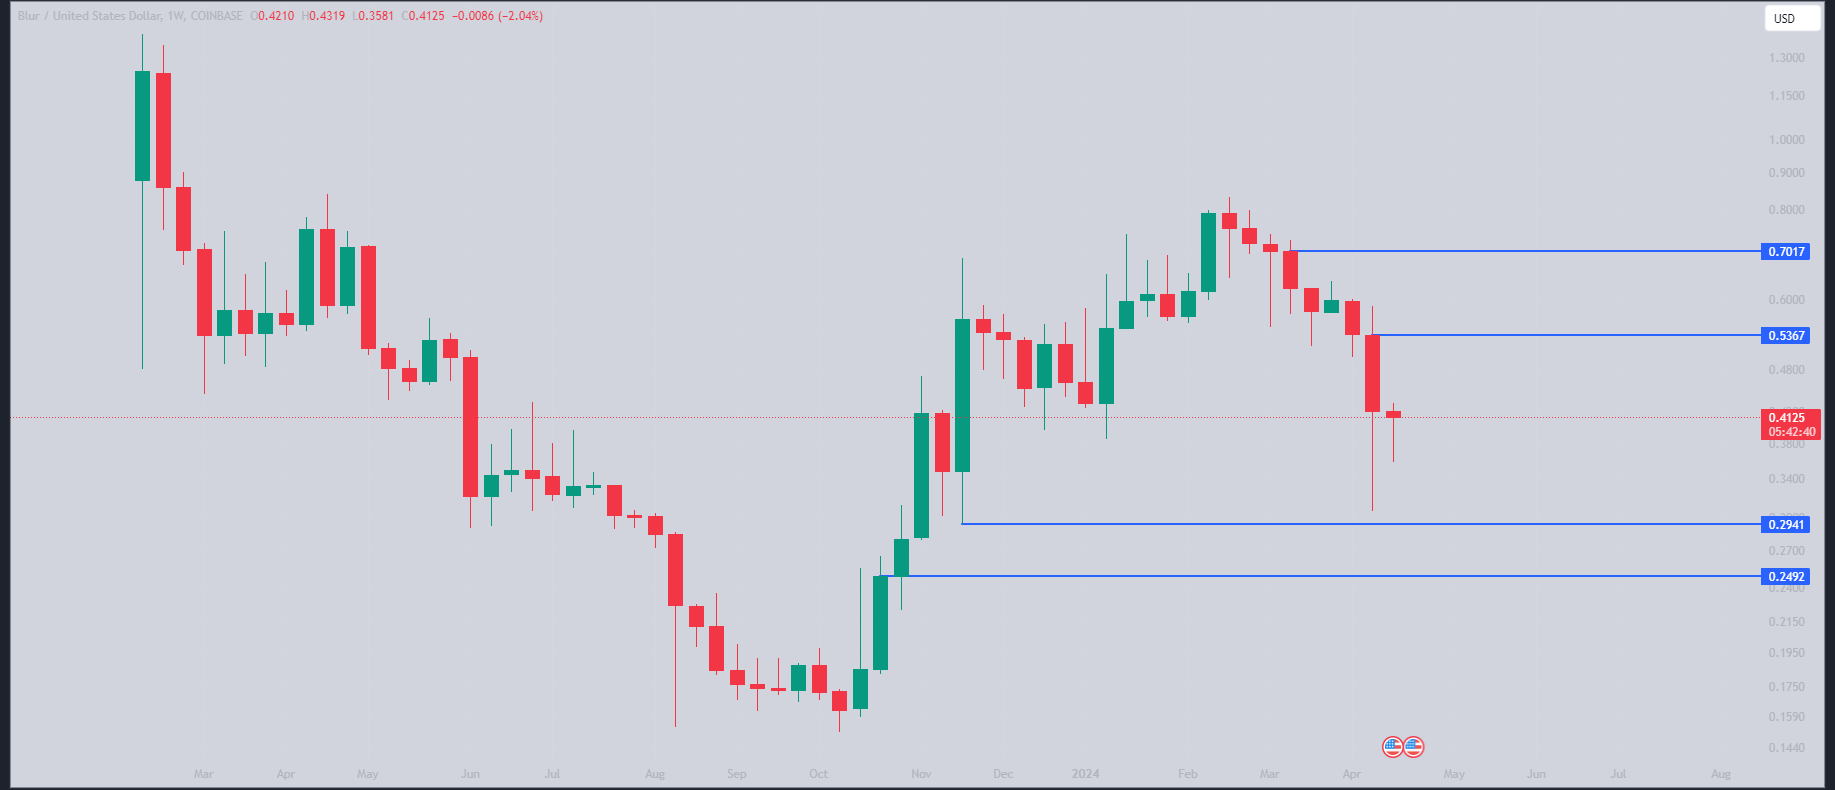
The weekly chart reveals a strong support level at $0.29 and indicates a potential bottom formation around $0.30. A breakout above $0.53 could trigger a significant bullish move.
Daily Chart: Bullish Reversal and Potential Targets
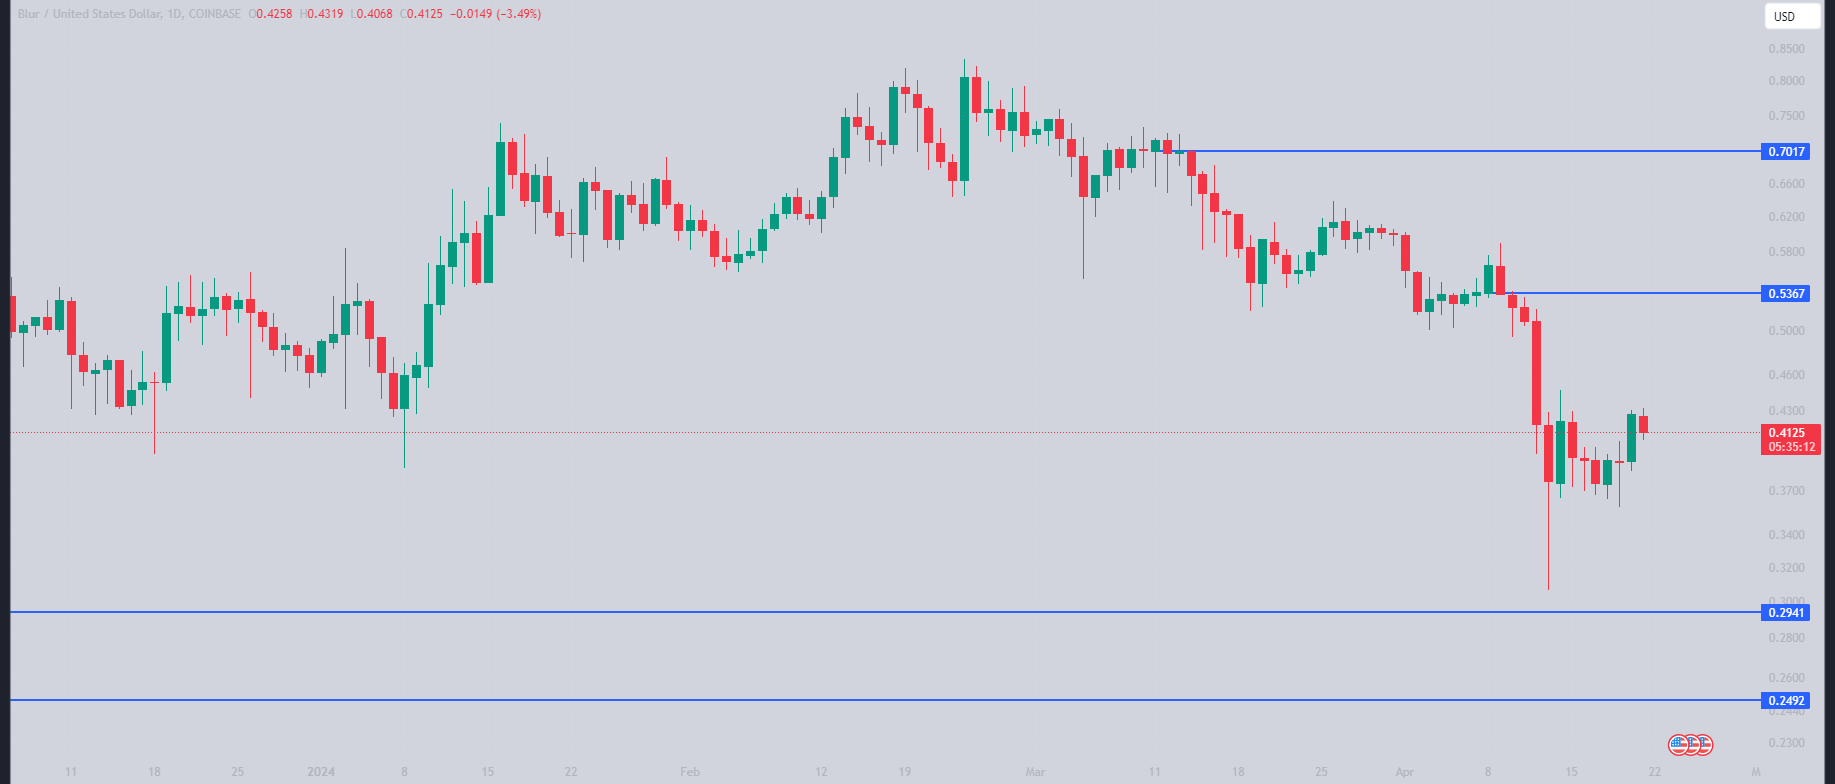
The daily chart confirms the presence of sell-side liquidity at $0.83. Following a successful retest of the $0.29 level, the price has established a new base around $0.30. A decisive breakout above $0.38 has created new liquidity zones, with the price currently attempting to absorb upper-level liquidity.
4-hour Chart: Ranging Structure and Potential Entry Point
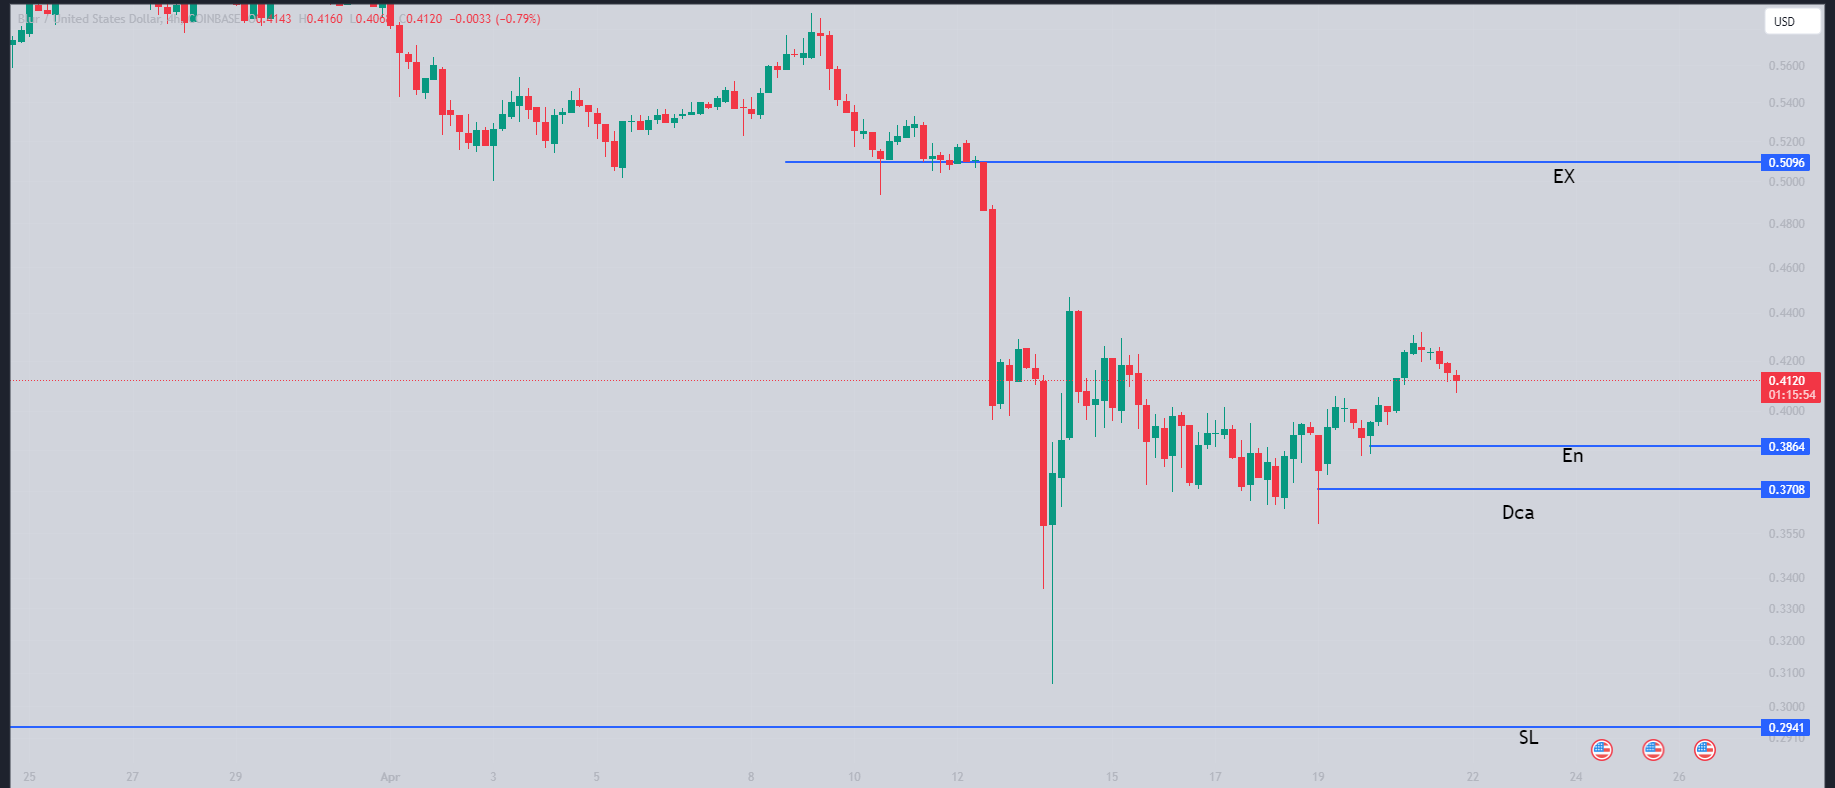
The 4-hour chart depicts a ranging structure with a range high of $0.43 and a range low of $0.35. The current price of $0.4125 is within this range. A retracement to the $0.386 level could present an entry opportunity, with subsequent DCA (Dollar-Cost Averaging) entries at $0.3708. A stop-loss order should be placed at $0.29, while the exit point is set at $0.509.
Disclaimer
It is crucial to emphasize that this analysis is solely intended for educational purposes and does not constitute financial advice. Any investment decisions based on this information are at your own discretion and risk.

