Stale Block in Blockchain Technology.
lhorgic

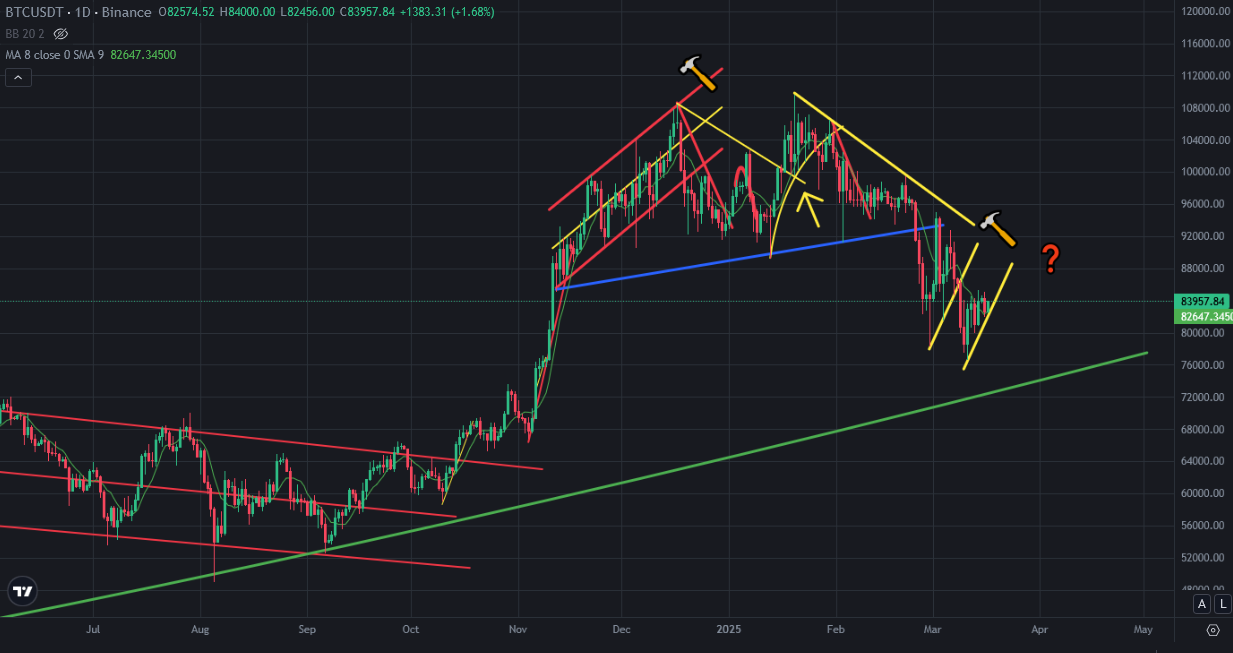
Bitcoin price is touching mini uptrend line as a few days before. Bitcoin may break down this mini uptrend line. If it breaks down, we may see price drop again on Bitcoin price chart but it may be the last price drop.
Here you can see daily chart of Bitcoin price. The momentum of price drop is decreasing. If Bitcoin breaks down this support line, we may see huge price drop on market. But these will be no more price drop on Bitcoin price chart. Because there is great bowl pattten on Bitcoin price chart and Bitcoin price is close this support line.
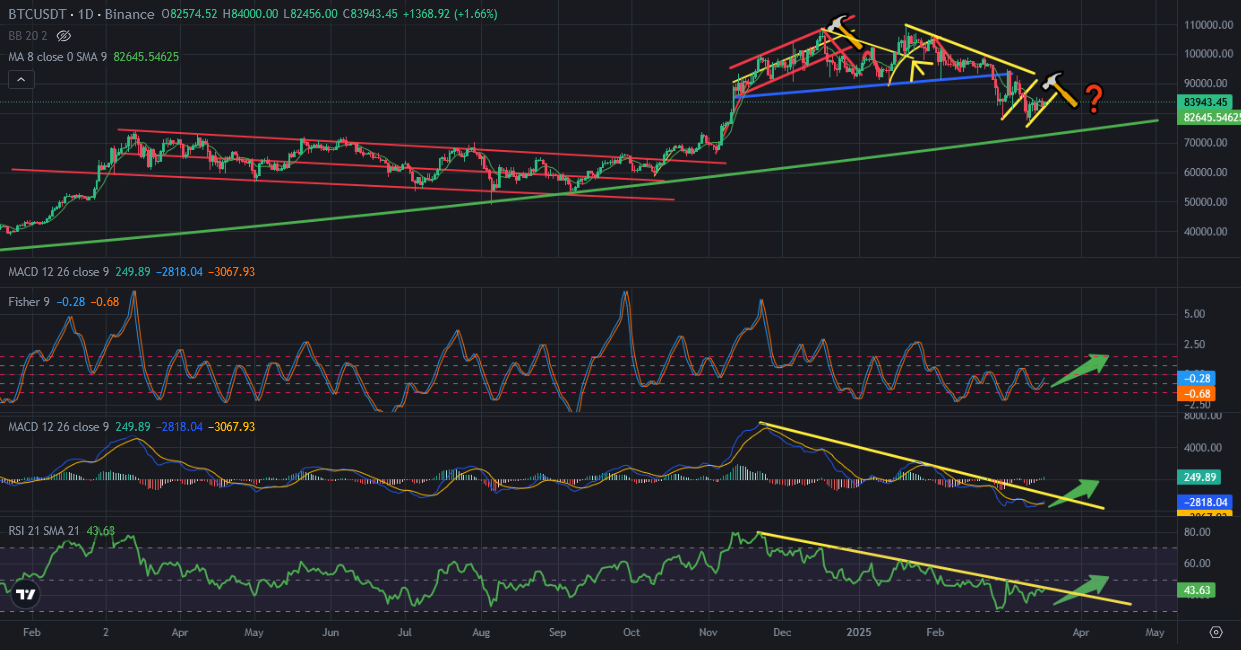
Here you can see the indicators on daily chart of Bitcoin. This is why I say that It may be the last price drop on Bitcoin price chart. I shared a few post about Bitcoin price analysis and said I was waiting price pump on Bitcoin price chart until end of March or the beginning of April.
There are major indicators has downtrend lines. They will be broken up in a few days. We will see what will happen after breaking up these downtrend lines on the indicators. There is also positive divergence on RSI Indicator. The bottom of indicators increasing but the bottom of price is decreasing. So, we may see price pump on Bitcoin in a few days.
Market maker may want to give fear to investors. It may be the last fear after breaking down mini uptrend line on Bitcoin price chart.
It may be great chance to pick up discounted cryptos. We will see..