Daily Steem Price Report [Jul 19, 2024]
sometacos

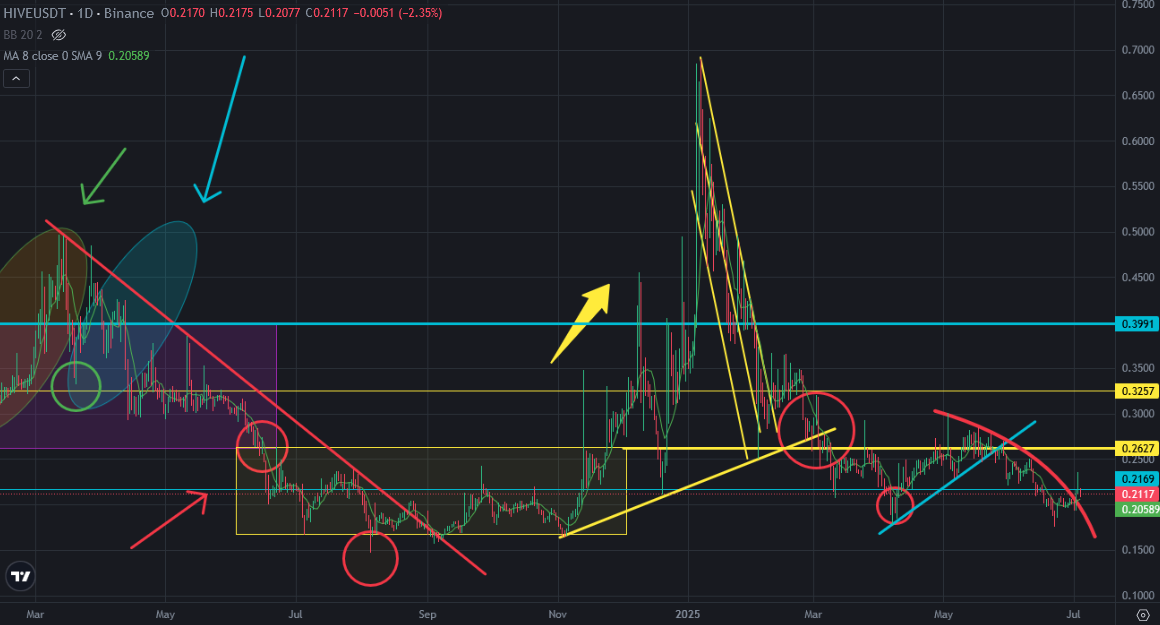
There was a curve resistance on Hive price chart. I sharted a few analysis about this resistance. Yesterday Hive price broke up this curve resistance and Hive price went up more than 10% in a day. This is how importance of resistance. It is broken up.
Here you can see daily chart of Hive price. There was mini uptrend line on Hive price chart and It was broken down a few days ago. You can see what happened after breaking down. Curve resistance is broken up now. We will see what will happen after this move. Hive price is tring to be above the middle line of depression zone. This is my draft I shared it a few years ago. You can how It worked as well..
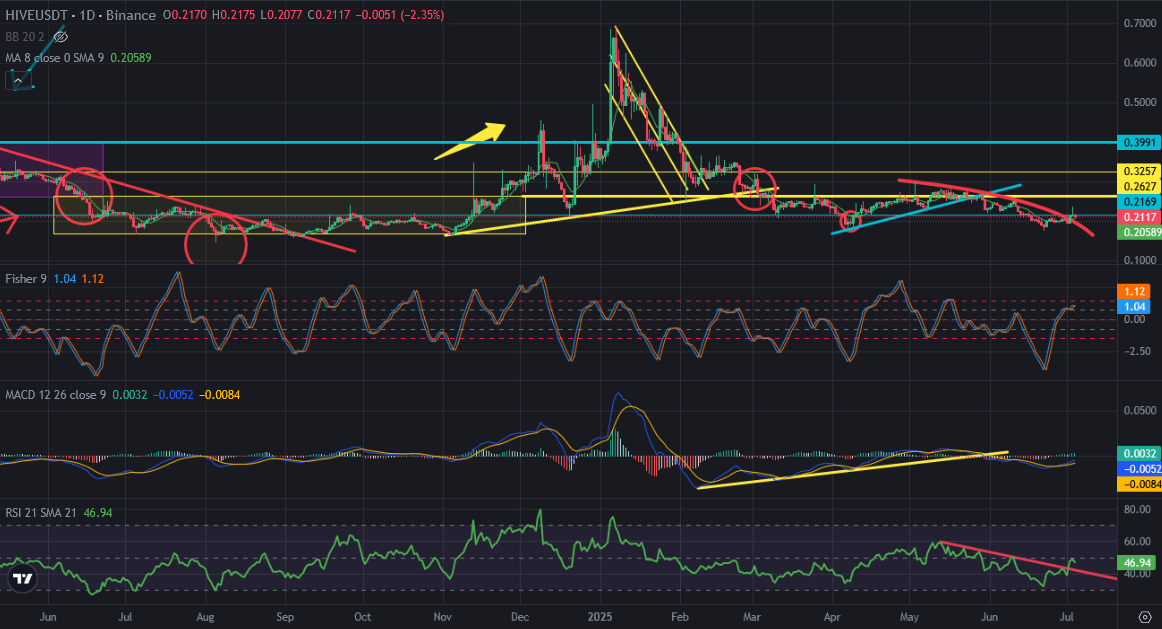
Here you can see the indicators on daily chart of Bitcoin price. There was also mini uptrend line on MACD Indicator. It was broken down a few days ago. There was mini downtrend line on RSI Indicator and It is broken up. Fisher Indicator is on the top. It may go up for a few days. So, We may see a few green daily candles on Hive price chart. We may see reversing down on Fisher Indicator after this move.
I shared lots of analysis about Bitcoin price chart and said I was waiting price pressure until end of July. So, we may see mini downtrend on Hive price until this date..
It is great time and level to pick up discounted Hive. Lower channel of depression zone is great place to pick up.
We will see..