La prossima grande criptovaluta a luglio 2025
vonnaputra

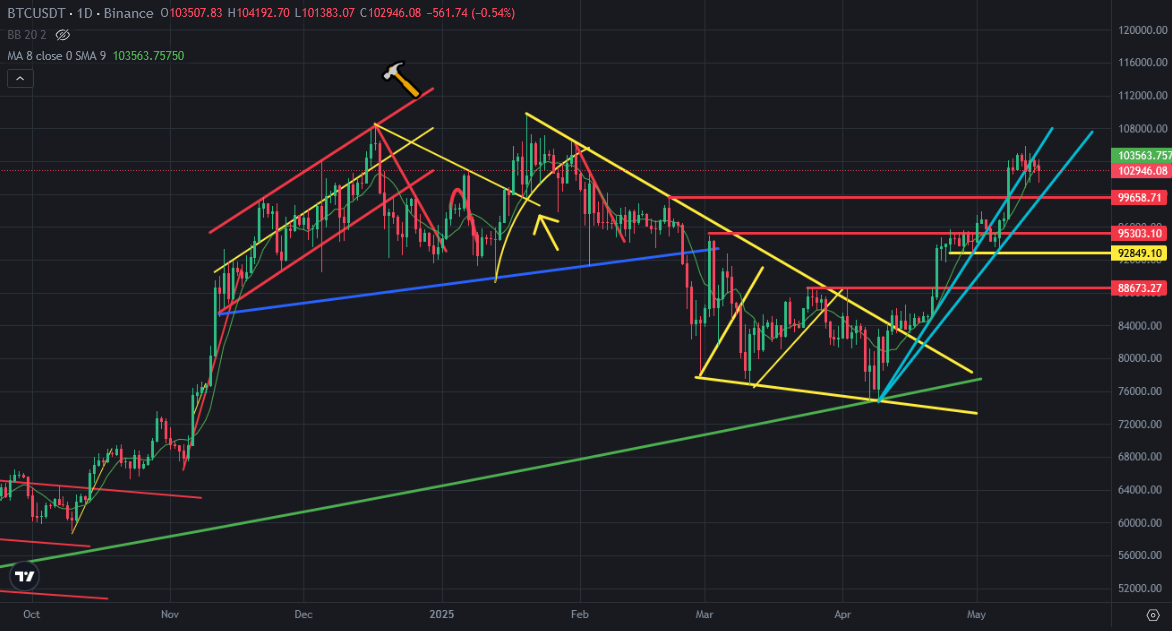
Bitcoin price is close to reverse down. Reversing confirmation appeared on Bitcoin price chart. Bitcoin price went up from 76K to 105K without any correction. We may see price correction on Bitcoin price chart after reversinf confirmations.
Here you can see daily chart of Bitcoin. We may see the first daily close below 8-day moving average after 96K. It is great signal for midterm. After closing this average, Bitcoin chances the trend for short, mid or longterm. If we look daily chart of Bitcoin, we can say it for short or midterm.
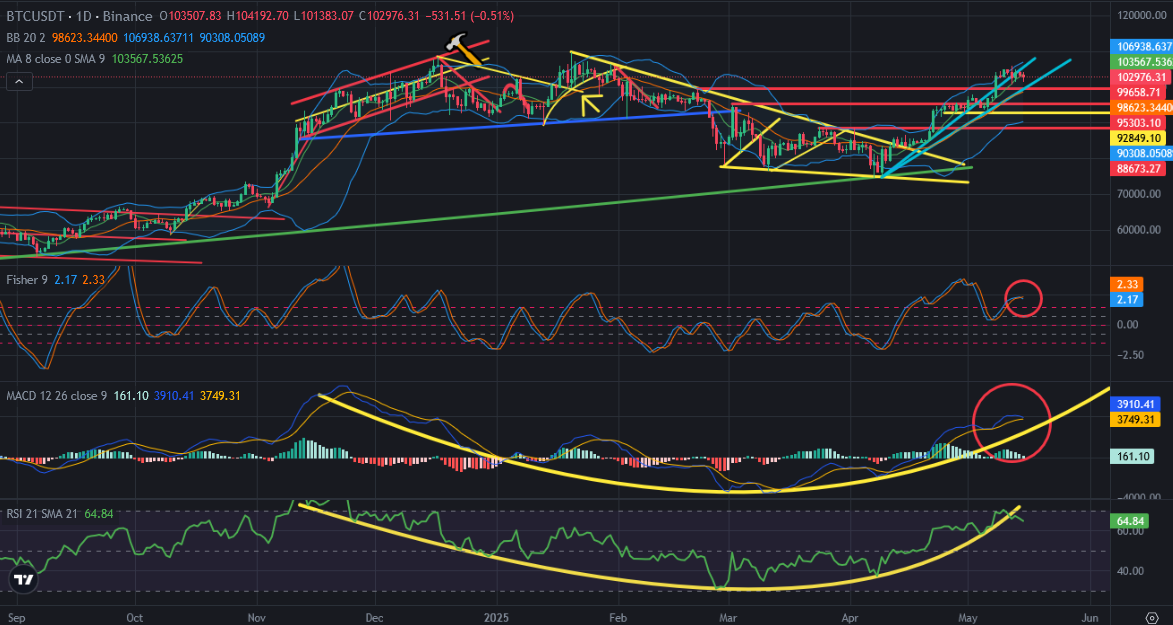
Here you can see the indicators on daily chart of Bitcoin. Fisher Indicator is close to reverse down. There were great bowl pattern on RSI Indicator and It is broken down. MACD Indicator is trying not to reverse down. MACD Indicator can nor resist to reverse down. When it reverses down, we may see huge price drops on Bitcoin price chart. Because MACD Indicator will break down great bowl pattern.
The middle line of Bollinger Bands on daily chart will be the first support for Bitcoin price chart. It is at 98600 USD level. After touching this support, we will focus the new support lines on Bitcoin price chart.
''Sell in May, go away'' may start. I shared lots of analysis about two side of the month. We have seen bullish side of May at the first half of the month. We will enter second half the monht tomorrow.
We will see..