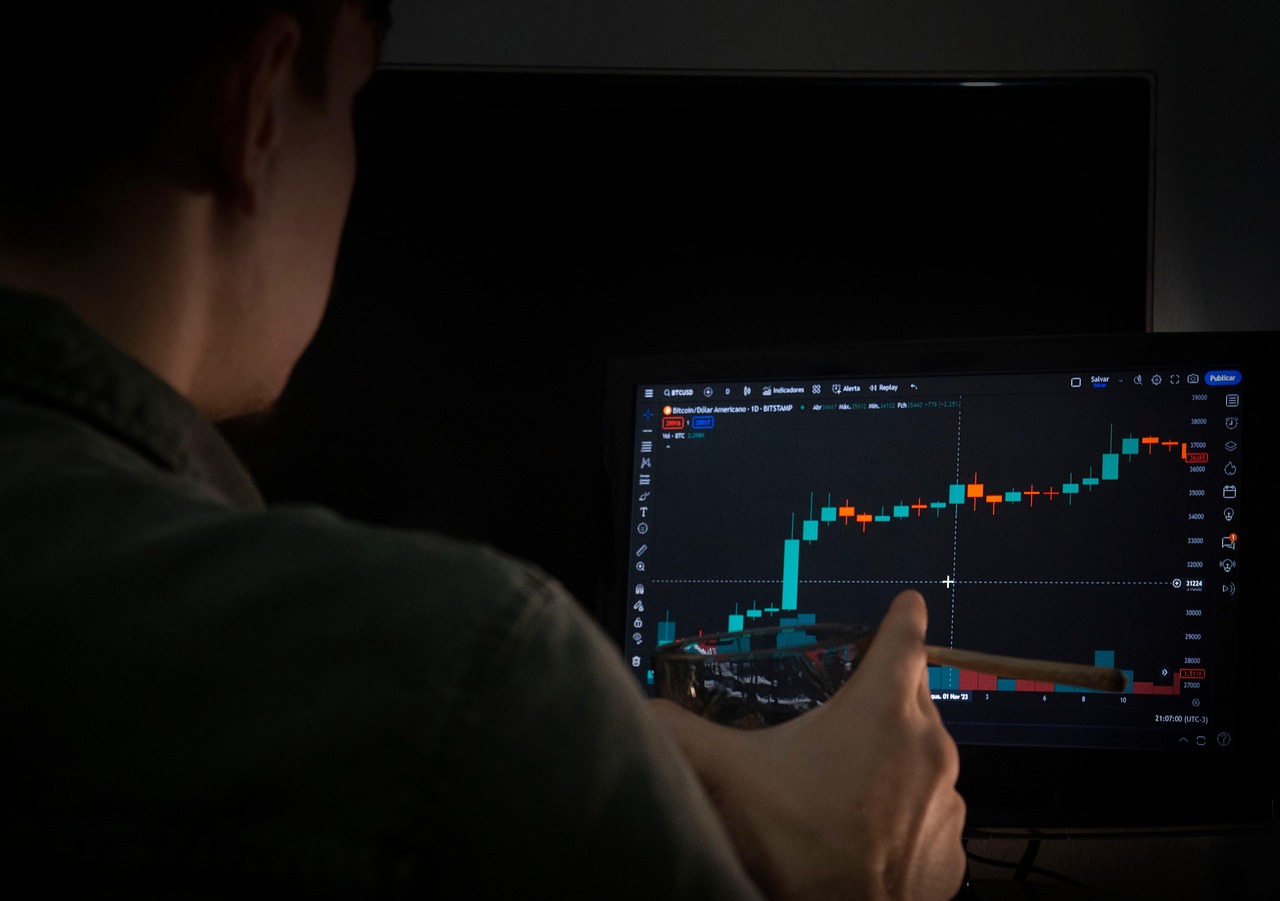
Bitcoin has undergone quite a correction after its price hit an all-time high. Bitcoin price drops from all-time high Bitcoin price gradually rises after touching 70K USD. However, currently the price of Bitcoin is slightly higher and is trading above 86 thousand dollars. But currently there is great resistance on the Bitcoin price chart coming from Bitcoin 108K USD. Bitcoin price may touch this resistance in a few days. Although there is no negative news in the market right now and everything is positive so do you think Bitcoin will bounce back from the highs or will Bitcoin break it?

[source](https://pixabay.com/photos/man-drinking-whiskey-brandy-liquor-8575459/)
Currently if you review the daily chart of bitcoin well you can guess a little bit and get some idea from there that bitcoin price or daily candle is tested 3 times before. Although the triple test has come back repeatedly but this time if the Bitcoin price breaks this great resistance, we can see a huge price move on the Bitcoin price chart. If not, there are great support lines on the Bitcoin price chart. But if it bounces back from there then Bitcoin price may fall to touch this great support line. That is why you can take a good look at the daily candles that Bitcoin has and from there you can make some assumptions that if the resistance at the highest level is broken then we can see a huge movement in Bitcoin. Indicators have a lot of downtrend lines. They are broken. RSI, MACD and Fisher indicator have broken resistance.
Also some important thing is that there are big whales who are tweeting something positive right now. Even a few days ago Michael Saylor who urges everyone to hold bitcoins and he said sell kidneys if necessary but save bitcoins. So it is expected that Bitcoin will soon break the high resistance. So, we are waiting for Bitcoin price to break up on the chart. The Fisher indicator is at the top and may reverse in a few days. So, Bitcoin needs to break the downtrend line quickly. If not, the Fisher Indicator will reverse within a few days. If you are in the market right now, you will see that the daily price of Bitcoin or the daily candles are slowly moving up, which is a positive side. It can break the great downtrend line. If not, don't worry.
It may take time but very soon Bitcoin will hopefully break this downtrend line in a few weeks. Although at the moment Bitcoin Dominance is a bit bullish, other altcoins are bearish and if Bitcoin Dominance is down by a large amount then we will see a good movement very soon and hopefully we can see a bullish trend in Bitcoin price chart till the end of March or early April.