Lombard is Making Bitcoin DeFi the Next Big Yield
mmaak7

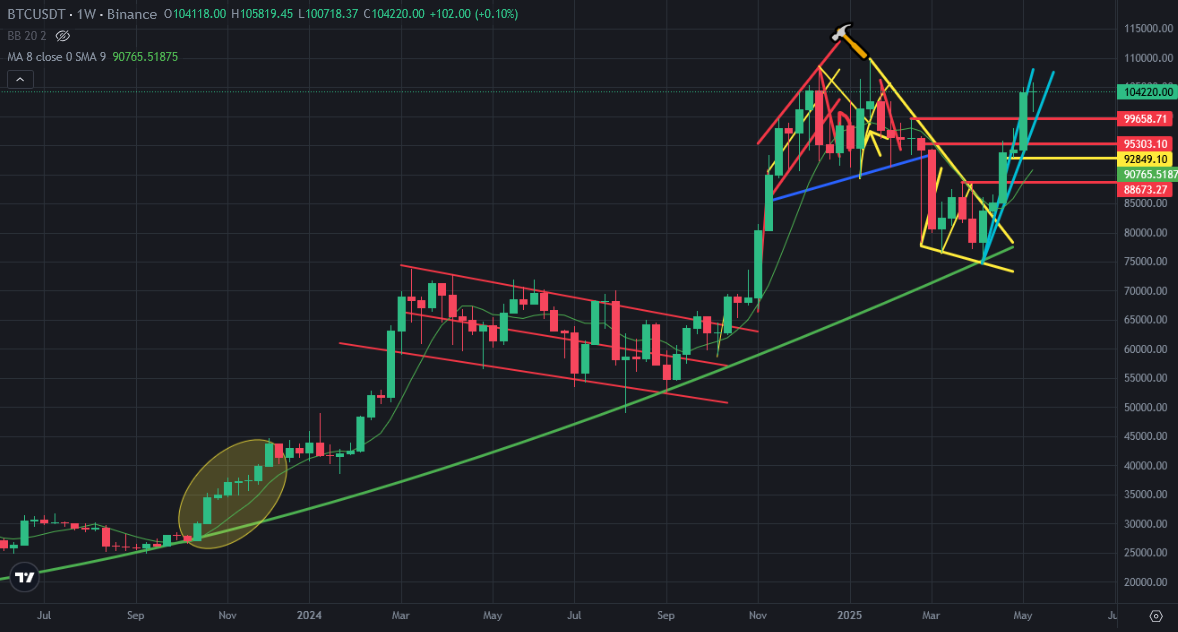
Even we have seen price small price corrections on Bitcoin price chart in this week, Bitcoin price has still green weekly candle. We have seen weekly green candle series at the end of 2023. After these green weekly candle series, Bitcoin price entered stable price situation.
Here you can see weekly chart of Bitcoin. Bitcoin got huge weekly green candles. After touching great support line of Bitcoin price chart, Bitcoin price got 6 green weekly candle. It is great perform for Bitcoin price. We may see price correction on Bitcoin price chart with red weekly candles.
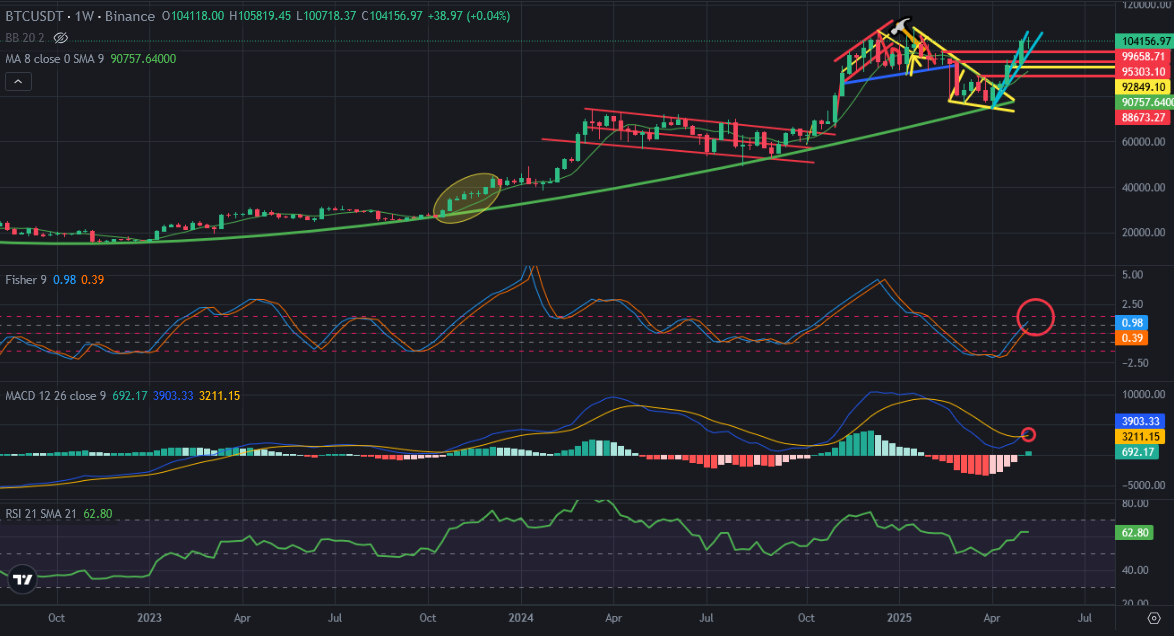
Here you can see the indicators on weekly chart of Bitcoin. MACD Indicator reversed from the bottom after correction. Fisher Indicator is close to reach the top. It may reverse down in a few weeks. If we see red weekly candle, Fisher Indicator will try to reverse down. When it reverses down, MACD Indicator may begin to try to reverse down.
It is more possible to see red green candle in next weeks.
Market maker is trying to make a fake move. We may see bullish and bearish traps after this time. When volatility gets higher, we will see fake moves..
We will see..